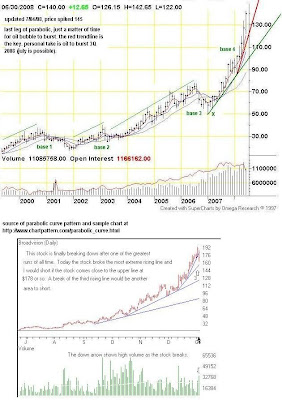

oil's is in its last parabolic leg. time analysis suggest it should end july til sep (max early oct) as base 3 (or the period covered by X) is only 10 months. in the sample chart of broadvision, the perfect parabolic curve of its X is also 10months and its last leg was due on the 8th time bar. on it's 9th time bar, broadvision broked the key reversal red trendline. im just fascinated by the resemblance of oil's parabolic with broadvision. unfortunately, prices cant be determine but if we use mathematical proportion we can guess.
broadvision x = 90, high = 138 (did not doubled in percentage but the leg is shortest in percentage increase); gain = 53%
last leg parabolic started 138 to 192 within 8 time bars.
% change = 192/138 = 39%
ratio of % gain: last leg parabolic of boradvision is 73.5% of it's X percentage gain. to show = 39/53 = 0.735
----
oil's x = 50, high = 98 ; gain 96%
oil's last leg started at 88 (base of red trendline)
solving for "guessed" max/high price of oil's last leg:
formula: projected max/high price of last leg = (start of oil's last leg parabolic) times (1+(percentage gain of oil's X) times (ratio of % gain of X and parabolic of broadvision))
given:
ratio of % gain of broadvision's X and last leg = 73.5% or 0.735
start of oil's last leg parabolic = 88
% gain of oil's x = 96% or 0.96
compute:
projected max/high price of last leg = 88 x (1+(0.96 x 0.735))= $150/bbl
caveat. there's no relation between broadvision and oil except similarity of their charts. there are other parabolic chart sample other than broadvision which could lead to different ratios and proportion. so happen both charts have similar wave counts (base 2 to base 3) and time correction pattern (base 4) as well as valid trendlines (4 of them with the red trendline as the key).
Support the street children movement.
this is spyfrat's post. :) spyfrat is a fllod victim and yet he still had the time to write something for us here!!! a true testament for his love of investing and trading. :) i decided to add little flavor to the blog by having a guest writer from a different school of thought. :) but of course i still believe the your investing style really depends on what your goals are and your tolerance for risk and patience. after all short term investors and long term investors are after the same thing PROFIT! we just have a different process of doing it. as they say in school in math class "the process doesnt matter as long as you get the right answer."
ps for any comments, questions or suggestion please email me at compounder888@gmail.com
i will also try to have a fundamental analysis of oil next time if i have the time. :)


 i will let the photos speak for itself. typhoon frank has hit iloilo hard. help is badly needed here. my high school batch is raising funds for the flood victims. please email me at compounder888@gmail.com if you want to make a donation. thank you very much and God bless.